
Tip
Tables, bar graphs, histograms, line graphs, scatterplots, dot plots, and circle graphs may be on the test.

Sample Problem
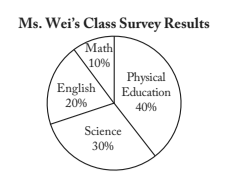
The 20 students in Ms. Wei’s class were surveyed as to which subject they enjoyed most. The results of the survey are displayed in the circle graph. How many students in Ms. Wei’s class chose either math or science?

Answer Options
(A) 2
(B) 6
(C) 8
(D) 12
(E) 40
View Correct Answer

(C) 8
Math and science make up 10% + 30% = 40% of the circle graph. Since (0.4)(20) = 8, there are 8 students who chose either math or science.
