
Tip
Graphs are used to present numerical information in visual form. A circle graph uses a divided circle to compare parts of the data to the whole data set. An example of a circle graph is shown below.

Sample Problem
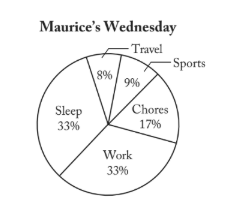
The circle graph shows the percent of a day that Maurice spends on different activities on Wednesday. On Saturday, Maurice plans on spending twice as much time on chores and sports as he does on Wednesday. Which of the following is the best estimate of the number of hours he will spend on chores and sports on Saturday?

Answer Options
(A) 4.3
(B) 8.2
(C) 12.5
(D) 14.2
(E) 15.8
View Correct Answer

(C) 12.5
Twice as much time on chores and sports is 2 × (9% + 17%) or 52%, so (0.52)(24) = 12.48 ≈ 12.5.
